Fiords and estuaries are inundated with seawater during incoming tides, and as the tide flows back out to sea it takes with it freshwater and nutrients and sediments from the surrounding land. This flushing action keeps inland waterways healthy by being free from various forms of stagnation. The salinity of an inland water, both on the surface and deeper down, is a useful guide to the rate and effectiveness of this flushing action. The rate itself is measured using an index called the Residence Time, and there are several ways of calculating this, such as modelling the relative volumes and rate of fresh water and seawater coming into the system, or by measuring salinity in various places in a fiord.
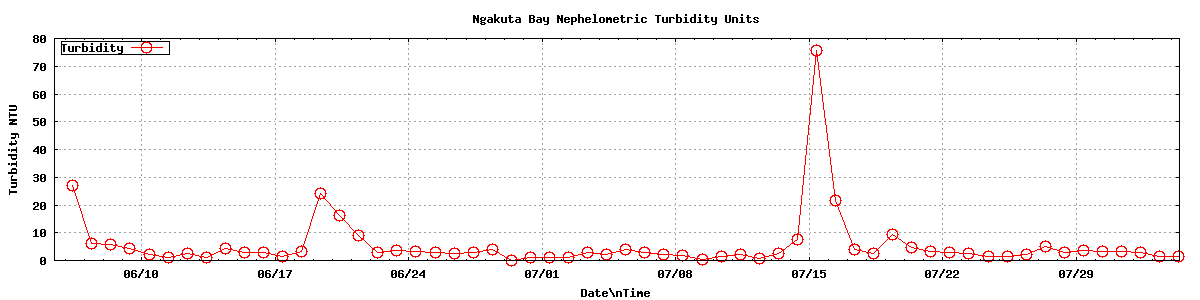
Turbidity is a measure of how clear the seawater is. Turbid water can cause many problems to living organisms, inluding reducing the effectiveness of a fish's gills to extract oxygen from seawater, and reducing light levels to plant life. There are two main causes of high turbidity - fine sedimens washed into the waterway by run-off from the land, and episodes of blooms of algae. As with salinity, turbidity is a useful measure of the general health of a body of water.
Historical Surveys of Water Residence Time and Salinity
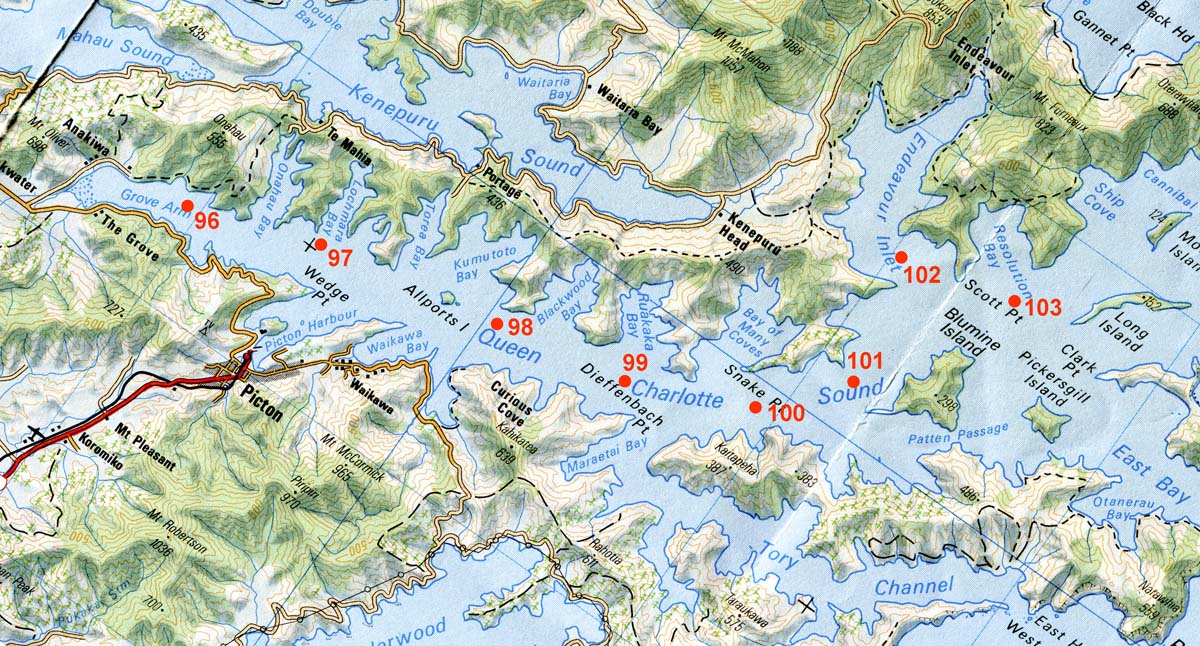
Much has been published about various aspects of the marine environment in the Marlborough Sounds, but the most thorough survey of salinity was that carried out by R.A. Heath in 1973 and published in 1974§1. R.V.Tangaroa was used for the survey, augmented by a 15 ft boat in shallower waters. Standard temperature/salinity/depth stations were established throughout Pelorus Sound from Havelock to West Entry, Kenepuru Sound, and in Queen Charlotte Sound from Long Island to Grove Arm. Of special relevance here is station 96, immediately to the west of Ngakuta Bay.
Heath was particularly interested in the circulation of seawater in and out of the Sounds during tidal changes and the residence time of freshwater from the surrounding catchments. Fresh water is less dense than seawater (specific gravity close to 1.0 g/ml, compared to about 1.025 for seawater), and in semi-enclosed waterways there can be a tendency for lower-salinity water to flow along the surface and out of enclosed bodies of water, while heavier, higher-salinity water can flow into the system along the bottom. This results in what is called a Classical Two-Layered Circulation System with inflow in the lower layer and outflow in the upper layer. Heath found little evidence for this type of system to develop in either Pelorus or Queen Charlotte Sounds.
Low residence time of water is extremely important for maintaining the general health of enclosed bodies of water such as fiords and estuaries. During historic times humans have been the cause of great stress in such systems by increasing sedimentation, nitrogen and phosphorus in the water from forest clearance and farming activities. High residence time encourages the accumulation of suspended particulate matter and algal blooms that reduce light penetration and affect the general health of such waterways. By contrast, rapid flushing of enclosed waterways ensures that there is insufficient time for sediment accumulation or depletion of dissolved oxygen. Ngakuta Bay has a large body of sediment close to the shoreline which is widely believed to be shoreline progradation relating to post-European activities. Further information on this issue can be found here.
For Pelorus Sound, Heath calculated from the ratio of the volume of fresh water in the sound to the inflow of fresh water that the average residence time was about 21 days (Heath 1974: 697). In a second paper (Heath 1976: 433, 442)§2 he calculated that the residence time for Queen Charlotte Sound would be about 1.7 times the Pelorus Sound estimate of 21 days. More recently, a report by the Cawthron Institute provides conservative estimates for the residence times for Pelorus and Queen Charlotte Sounds as 14 and 36 days respectively, taking an average of the Spring and Neap values (Gillespie et al. 2011: 11)§3. As with Heath's research, Queen Charlotte Sound is seen as having a much longer residence time. In an on-line report of Marlborough District Council entitled Ecologically significant marine sites in Marlborough it is stated that "The mean residence time of water in the main channel [of Queen Charlotte Sound] is approximately 31 days". I have not been able to find the source of this estimate.
Whatever the exact figures might be, the fact remains that Queen Charlotte Sound clearly has a much longer residence time than Pelorus Sound and we might therefore expect that it will be more prone to potential problems of general health as a result. Moreover, the residence time and flushing characteristics of the main channels of these sounds is not the same as that which prevails in small semi-enclosed areas. Citing unpublished data, The Cawthron Institute report warns that "The longer water-residence time and higher water column stability of embayments off the main channels results in these regions frequently supporting dinoflagellate-dominated communities" (Gillespie et al. 2011: 7). There is thus good reason for monitoring such small embayments wherever possible.
§1Health, R.A. 1974. Physical oceanographic observations in Marlborough Sounds.
New Zealand Journal of Marine and Freshwater Research, 8(4): 691-708.
§2Heath RA 1976. Broad classification of New Zealand inlets with emphasis on residence times.
New Zealand Journal of Marine and Freshwater Research 10 (3): 429-444.
§3Gillespie, P., Knight, B. and MacKenzie, L. 2011. The New Zealand King Salmon Company Limited: Assessment of Environmental Effects - Water Column. Unpublished Report No. 1985, prepared for New Zealand King Salmon Ltd, August 2011. Cawthron Institute.
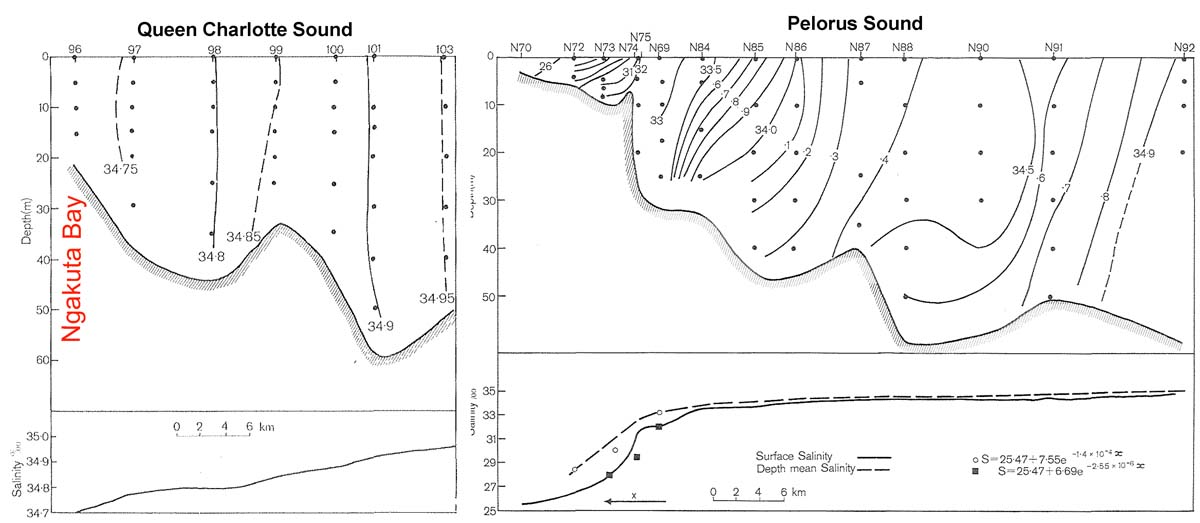
Heath's salinity values by depth are summarised in the two graphs below (from Heath 1974: 696, 697). The vertical profiles for Pelorus Sound are especially interesting and reveal a tendency for increasing salinity with depth, and more dilution with fresh water closer to the surface. There is clear horizontal stratfication closer to Havelock on the left. This is a modest indication of the Two-Layered Circulation System, mentioned above. Queen Charlotte Sound is in marked contrast to this with no sign of vertical changes of salinity with depth. The actual figures for Station 96, close to Ngakuta Bay in the main channel of Grove Arm are (Heath, 1976: 708):
| Metres Depth | Temperature °C | Salinity ‰ |
|---|---|---|
| 0 | 11.26 | 34.71 |
| 5 | 11.15 | 34.71 |
| 10 | 11.1 | 34.71 |
| 15 | 11.23 | 34.71 |
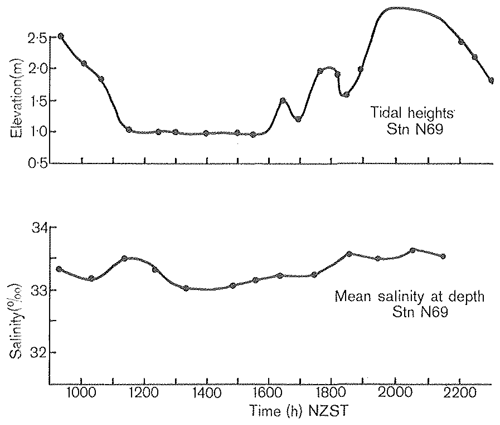
Heath monitored salinity during one complete tidal cycle and his graph appears below (from Heath (1974: 698). This shows only minor fluctuation during the change from high to low and back to high again. Station N69 is at the entrance to Kenepuru Sound.
Current Monitoring of Ngakuta Bay Salinity and Turbidity
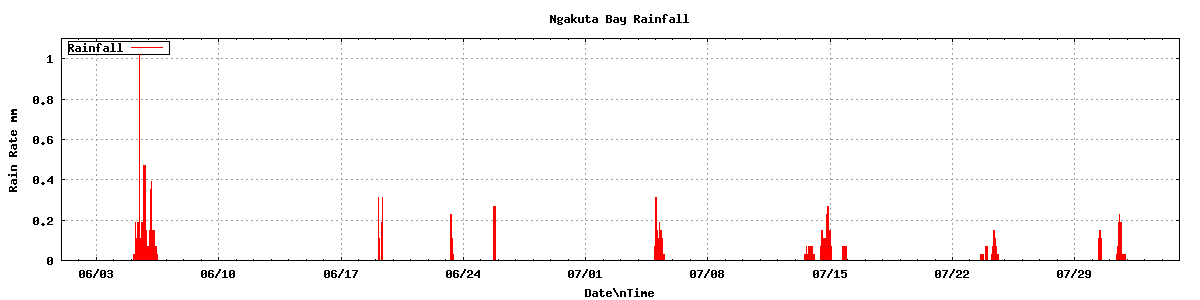
Samples of seawater are taken every day about 9am from the end of the Jetty on the western side of Ngakuta Bay and measurements taken with Vernier equipment, available in New Zealand through Electroflash Resourcing ltd. The salinity sensor is model SAL-BTA, which with software cost $407, and the Turbidity sensor is model WQ730, which, with some extra sample vials, cost $381. Since Heath found little change during the tidal cycle it was considered that adopting a fixed time of day to collect samples would be acceptable as well as most convenient. The results, presented below, bear out this suggested consistency during tidal movements.
Salinity and Turbidity during High Rainfall at Ngakuta Bay
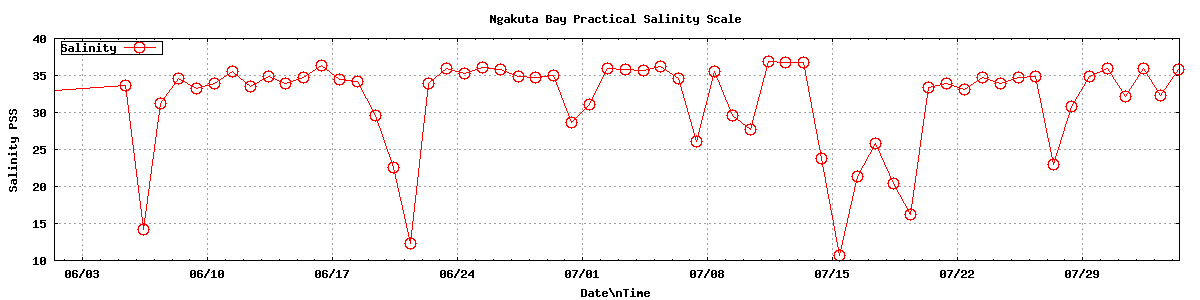
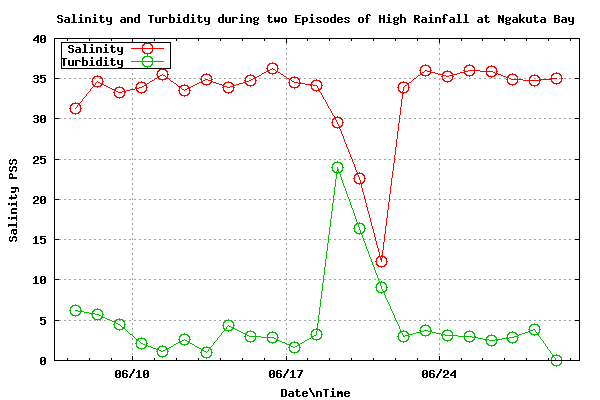 This graph shows a typical example of what can happen to salinity and turbidity during a period of high rainfall. The rain resulted in a pronounced fall in salinity from June 19-21. The turbidity values are clearly highly correlated with these changes in salinity. The increase of turbidity was caused by rainfall and runoff from the land with fine sediments clouding the inshore waters. It may be noticed that there is a lag in the timing of changing salinity and turbidity values during the episode of high rainfall which lasted four days. The salinity levels remainded low even when the waters were clearing, manifest by lower turbidity values. This is probably because fine suspended sediments were settling out close inshore rather than being flushed out of Ngakuta Bay into Grove Arm arm and beyond. This is the very issue, described above, in the Cawthron Institute report, where they describe evidence of longer water-residence time and higher water column stability of embayments off the main channels. It is planned to take samples at different depths in Ngakuta Bay in the future as it is suspected that these periods of rainfall will result in distinct layering for a time.