
Freshwater and Seawater
Residents in Ngakuta Bay are familiar with the fact that the top metre of sea water is often noticeably
warmer than deeper, particularly during periods of warm weather. The shallower water is heated from the
sun more than deeper water due to slow vertical mixing. The opposite occurs when there has been heavy
rainfall when cool fresh water can temporarily form a colder layer near the surface. Sea water is denser
(average about1.025) than fresh water (closer to 1.0 g/ml), and therefore, fresh water can "float" on
top of salt water. The Ghyben-Herzberg lens of freshwater on atolls is a special case of
this phenomenon.
Time for a swim
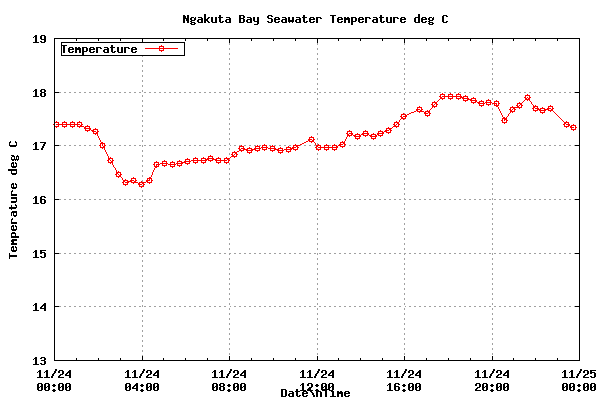
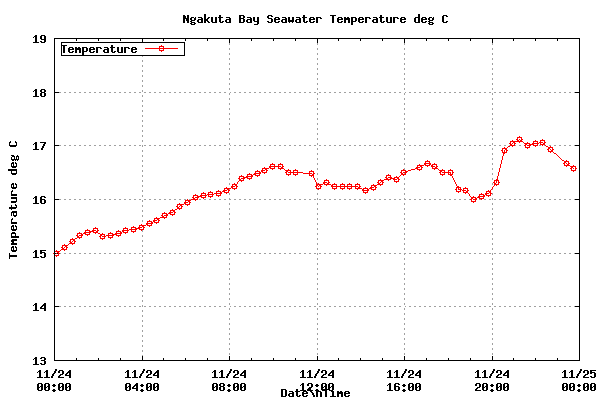
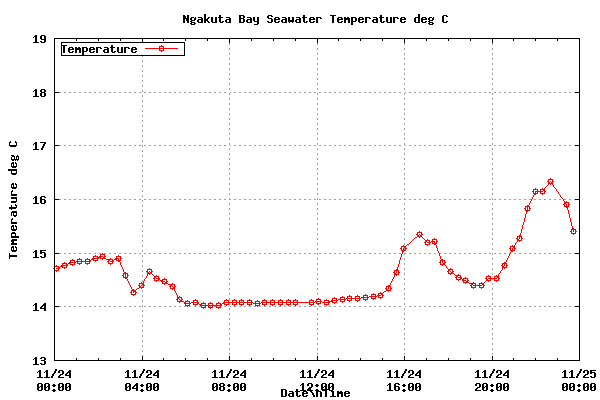
People living at Ngakuta Bay as well as visitors regularly swim in the bay and a hot topic of discussion
is always how warm or cold the water is. The best guide to this is the graph below for Sensor 1 which
monitors the temperature at 1 metre depth. The graph also helps to identify the best time of day
for a swim when the water is warmest
More on the Project
Logging temperature at different depths in Ngakuta bay is only the first step in a more ambitious project
which is to correlate this with similar information on changing levels of salinity and turbidity
in seawater and episodes of algal bloom and dramatic increases of jellyfish in the Bay.
A good indication of the general health of Ngakuta Bay is the changing abundance of eel-grass
Zostera capricorni. A severe winter storm not only causes eutrophication which can enhance
beds of eel-grass, but it can also dump large quantities of new sediment and scour out existing
beds of eel-grass. More on the importance of these eel-grass beds is outlined in the web page on
Salt Meadows at Ngakuta Bay.
A modest start has been made on logging other characteristics of seawater
in Ngakuta Bay, and details can be found on a separate page:
Logging Salinity and Turbidity
Monitoring Seawater Temperature
Setting up a system for logging seawater temperature at different depths is not simple, especially
when it is self-funded and everything is home-brew rather than off-the-shelf equipment.
The temperature measuring device is a unique solid-state sensor made by Maxim Integrated Products
(Dallas Semiconductor). The resolution is programmable and digital information from mutliple sensors
is transmitted along one wire to a microprocessor controller. Teasing apart which measurement comes
from which depth is made possible by a 64 bit serial number unique to each sensor. If a request
for information is made using the serial number, only the correct device will report back.
How cunning is that! Further details can be found on a separate page:
Technical Details.
Acknowldgements
Developing the software for this monitoring system has been a collaborative venture
between myself (Foss Leach, ZL2JKP), Pete Mundy in Nelson (ZL2FSK), Peter Jaquiery in Dunedin,
and Dr Martin Krafft in Munich,
and would not have been possible without this input of free time and friendly help from all concerned.
I would also like to acknowledge the contribution of David Pook who provided the facilities at
Westshore Marine Ltd for coating the seawater monitoring cable with antfoul.
This used 4 litres of Altex Coating Industrial & Marine antifoul paint which he
generously donated to the project. The electronics and thermal monitoring cable
are placed on a boat in Ngakuta Bay, with the cable attached to the stern railing
to avoid becoming entangled in the mooring line. From time to time it is necessary
to move it from one vessel to another as the owner uses his boat for its original purpose.
Grateful thanks are due to Kim Saunders-Singer in Picton for the use of his launch, The Nelly,
and to Professor Atholl Anderson of Blenheim for allowing his yacht, Cepheus, to be used for
this project.
One of the residents of Ngakuta Bay who wishes to remain anonymous
made a donation of $250 to help this project along. This has been
put towards a sensor for monitoring the level of dissolved oxygen
in seawater in the Bay. This unexpected gesture of support and
interest is most gratifying.

 Battery Monitor
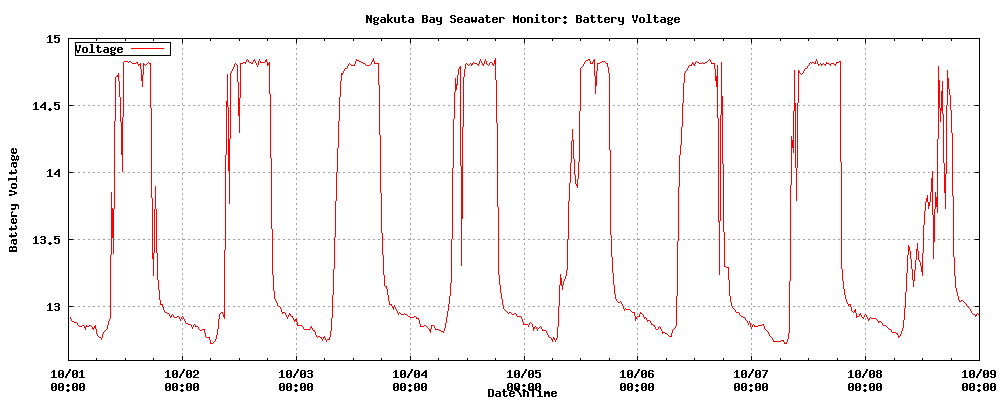
Voltage history from the beginning of this present month.
Fluctuations relate to variable performance of the solar panel.
The system will continue to operate unless the battery falls below 5v.
There is an early warning system in place run by the computer which
keeps track of the system, and this rings a bell if the voltage falls below 9v
 Sensor 1 metres depth
Statistics for this sensor for the last 24 hours
Minimum Temperature = 12.68
Maximum Temperature = 13.57
Mean Temperature = 13.22 ± 0.19
Standard Deviation = 0.02 ± 0.02
Coefficient of Variation = 1.41 ± 0.13
 Sensor 2 metres depth
Statistics for this sensor for the last 24 hours
Minimum Temperature = 13.11
Maximum Temperature = 13.41
Mean Temperature = 13.25 ± 0.09
Standard Deviation = 0.01 ± 0.01
Coefficient of Variation = 0.64 ± 0.06
 Sensor 3 metres depth
Statistics for this sensor for the last 24 hours
Minimum Temperature = 13.16
Maximum Temperature = 13.35
Mean Temperature = 13.30 ± 0.06
Standard Deviation = 0.01 ± 0.01
Coefficient of Variation = 0.41 ± 0.04
 Sensor 4 metres depth
Statistics for this sensor for the last 24 hours
Minimum Temperature = 13.16
Maximum Temperature = 13.37
Mean Temperature = 13.29 ± 0.04
Standard Deviation = 0.01 ± 0.00
Coefficient of Variation = 0.31 ± 0.03
 Sensor 5 metres depth
Statistics for this sensor for the last 24 hours
Minimum Temperature = 13.24
Maximum Temperature = 13.37
Mean Temperature = 13.30 ± 0.03
Standard Deviation = 0.00 ± 0.00
Coefficient of Variation = 0.24 ± 0.02
 Sensor 6 metres depth
Statistics for this sensor for the last 24 hours
Minimum Temperature = 13.24
Maximum Temperature = 13.38
Mean Temperature = 13.31 ± 0.03
Standard Deviation = 0.00 ± 0.00
Coefficient of Variation = 0.25 ± 0.02
 Sensor 7 metres depth
Statistics for this sensor for the last 24 hours
Minimum Temperature = 13.26
Maximum Temperature = 13.35
Mean Temperature = 13.30 ± 0.03
Standard Deviation = 0.00 ± 0.00
Coefficient of Variation = 0.22 ± 0.02
 Sensor 8 metres depth
Statistics for this sensor for the last 24 hours
Minimum Temperature = 13.24
Maximum Temperature = 13.36
Mean Temperature = 13.30 ± 0.03
Standard Deviation = 0.00 ± 0.00
Coefficient of Variation = 0.23 ± 0.02
 Sensor 9 metres depth
Statistics for this sensor for the last 24 hours
Minimum Temperature = 13.20
Maximum Temperature = 13.36
Mean Temperature = 13.27 ± 0.03
Standard Deviation = 0.00 ± 0.00
Coefficient of Variation = 0.25 ± 0.02
 Sensor 10 metres depth
Statistics for this sensor for the last 24 hours
Minimum Temperature = 12.97
Maximum Temperature = 13.40
Mean Temperature = 13.28 ± 0.10
Standard Deviation = 0.01 ± 0.01
Coefficient of Variation = 0.73 ± 0.07